A look into 1H-2025 Vulnerability Exploitation
In the first half of 2025, VulnCheck identified 432 CVEs with evidence of exploitation in the wild for the first time. Known exploited vulnerabilities were disclosed by 82 distinct sources. We continue to see vulnerabilities being exploited at a fast pace with 32.1% of vulnerabilities being exploited on or before the day of the CVE disclosure, often representing zero-day exploitation. This demonstrates the need for defenders to move quickly on emerging threats while continuing to burn down their vulnerability debt.
Here are the key takeaways from our analysis and coverage of known exploited vulnerabilities
- 432 CVEs were reported as being exploited for the first time and added to VulnCheck KEV in 1H-2025
- 32.1% of KEVs had exploitation evidence on or before the day the CVE was issued, an increase from 23.6% in 2024.
- Reported exploitation attributed to threat actors in China and North Korea decreased while exploitation attributed to Russia and Iran threat actors increased.
- 26.9% of KEVs first seen in the 1H-2025 were still awaiting analysis by NIST
- While Open Source Software is impacted by a growing number of exploited vulnerabilities, our research shows that proprietary software such as CMS platforms and plug-ins, network edge devices, and server software are larger contributors to mass exploitation - not necessarily open source software.
- 147 of 181 unique CVEs that were used by known threat actors had evidence of exploitation prior to 2025, demonstrating that threat actor exploitation disclosure often lags behind disclosure of initial exploitation evidence.
How Quickly are Vulnerabilities Being Exploited?
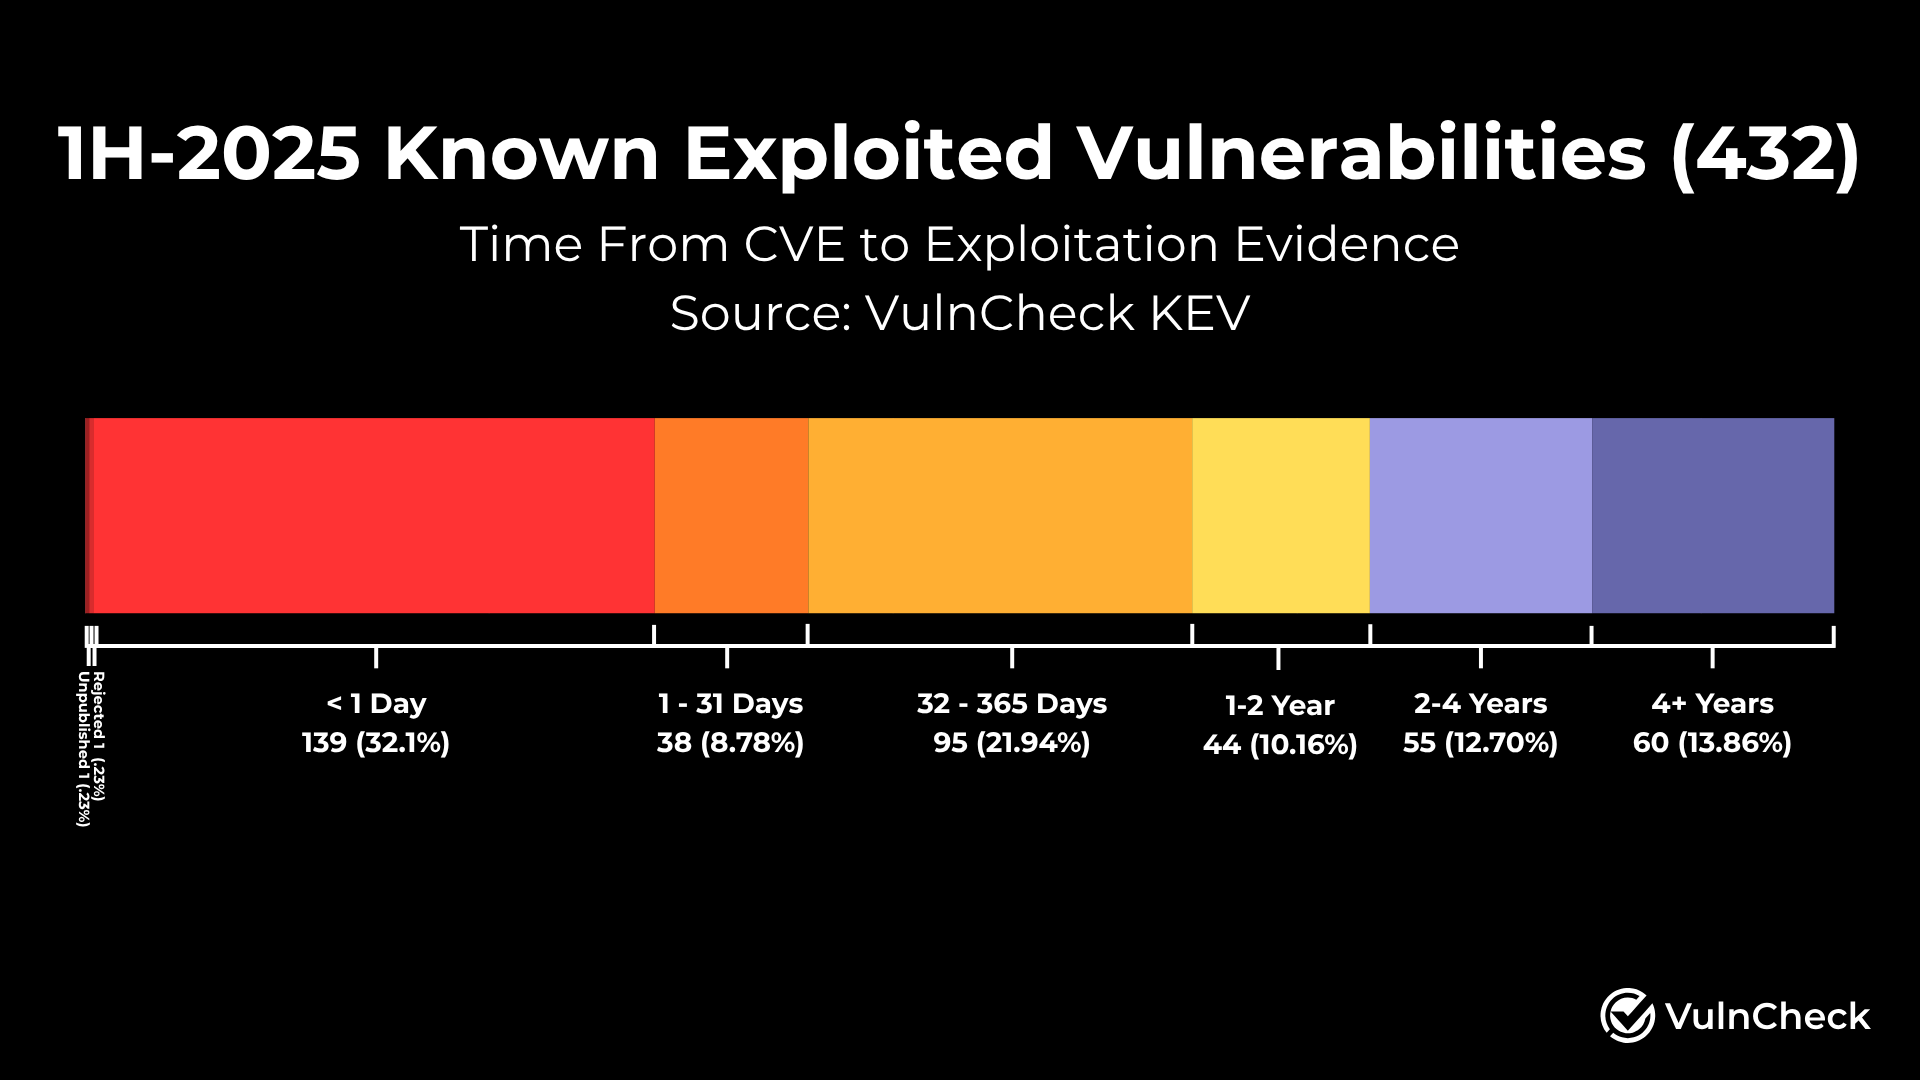
When we examine the time from CVE disclosure to exploitation evidence, we gain a better understanding of how quickly vulnerabilities are being exploited. We observed an 8.5% increase in the percentage of KEVs that had exploitation evidence disclosed on or before the day a CVE was published (32.1% in 1H-2025 as compared to the 23.6% we reported in 2024. There are several nuances to consider. Additional evidence sourced from 2024 has increased this percentage over time, which is more aligned with what we are seeing in the 1H-2025. In addition, VulnCheck also issued 32+ CVEs for vulnerabilities after auditing Shadowserver in June, where there was evidence of exploitation but no CVE had been assigned, as we work to provide broader visibility for defenders through our contributions to the CVE program as a CVE numbering authority.
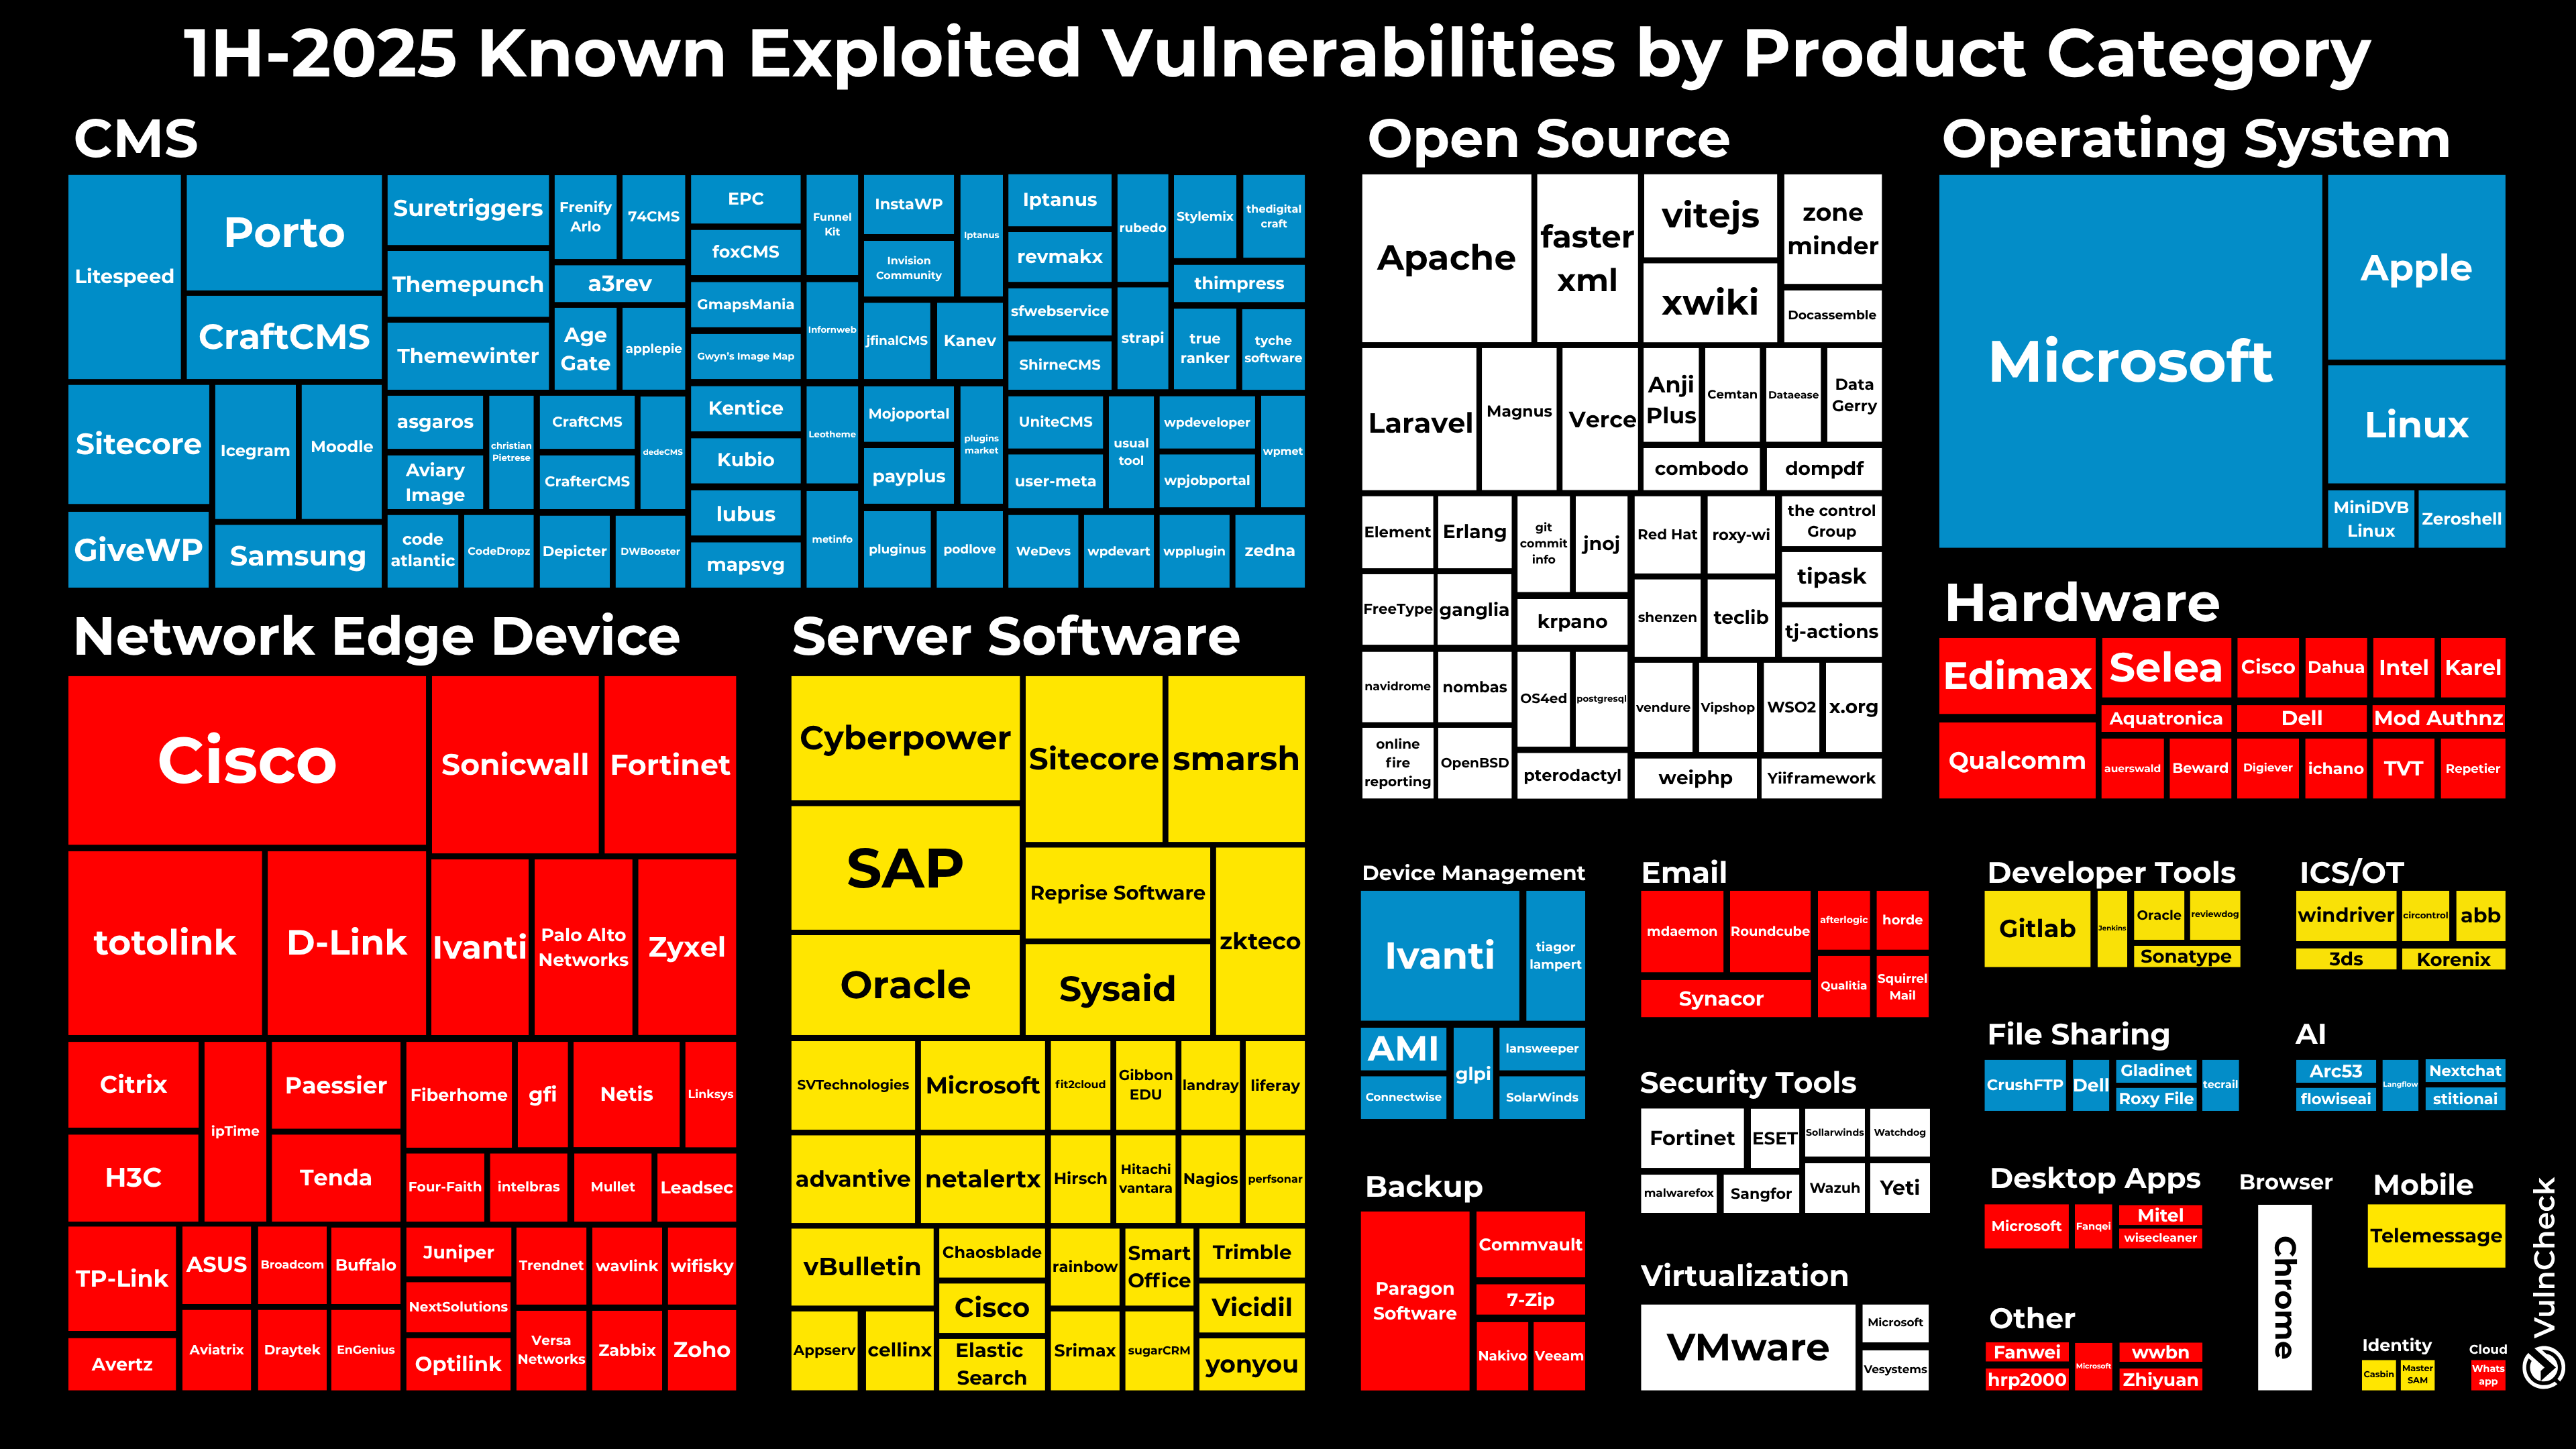
Exploring Categories and Technologies
Five KEV categories continue to top the list for the 1H-2025, including:
- Content Management Systems (86) - A significant volume of this can be attributed to Wordpress Plug-ins 🙄
- Network Edge Devices (77)
- Server Software (61)
- Open Source Software (55)
- Operating Systems (38)
The Hardware category had a notable increase in KEVs as VulnCheck issued CVEs for several vulnerabilities targeting camera systems, DVRs, and IP phones, among other hardware devices, where exploitation evidence had been identified by Shadow Server.
Vendors with the highest number of KEVs in the 1H2025 included:
- Microsoft (32) - it’s worth noting that 26 of these KEVs are for Windows.
- Cisco (10) - several are older vulnerabilities across multiple product lines.
- Apple OS (6)
- Totolink Networking Devices (6)
- VMware (6)
Which source first reported exploitation?
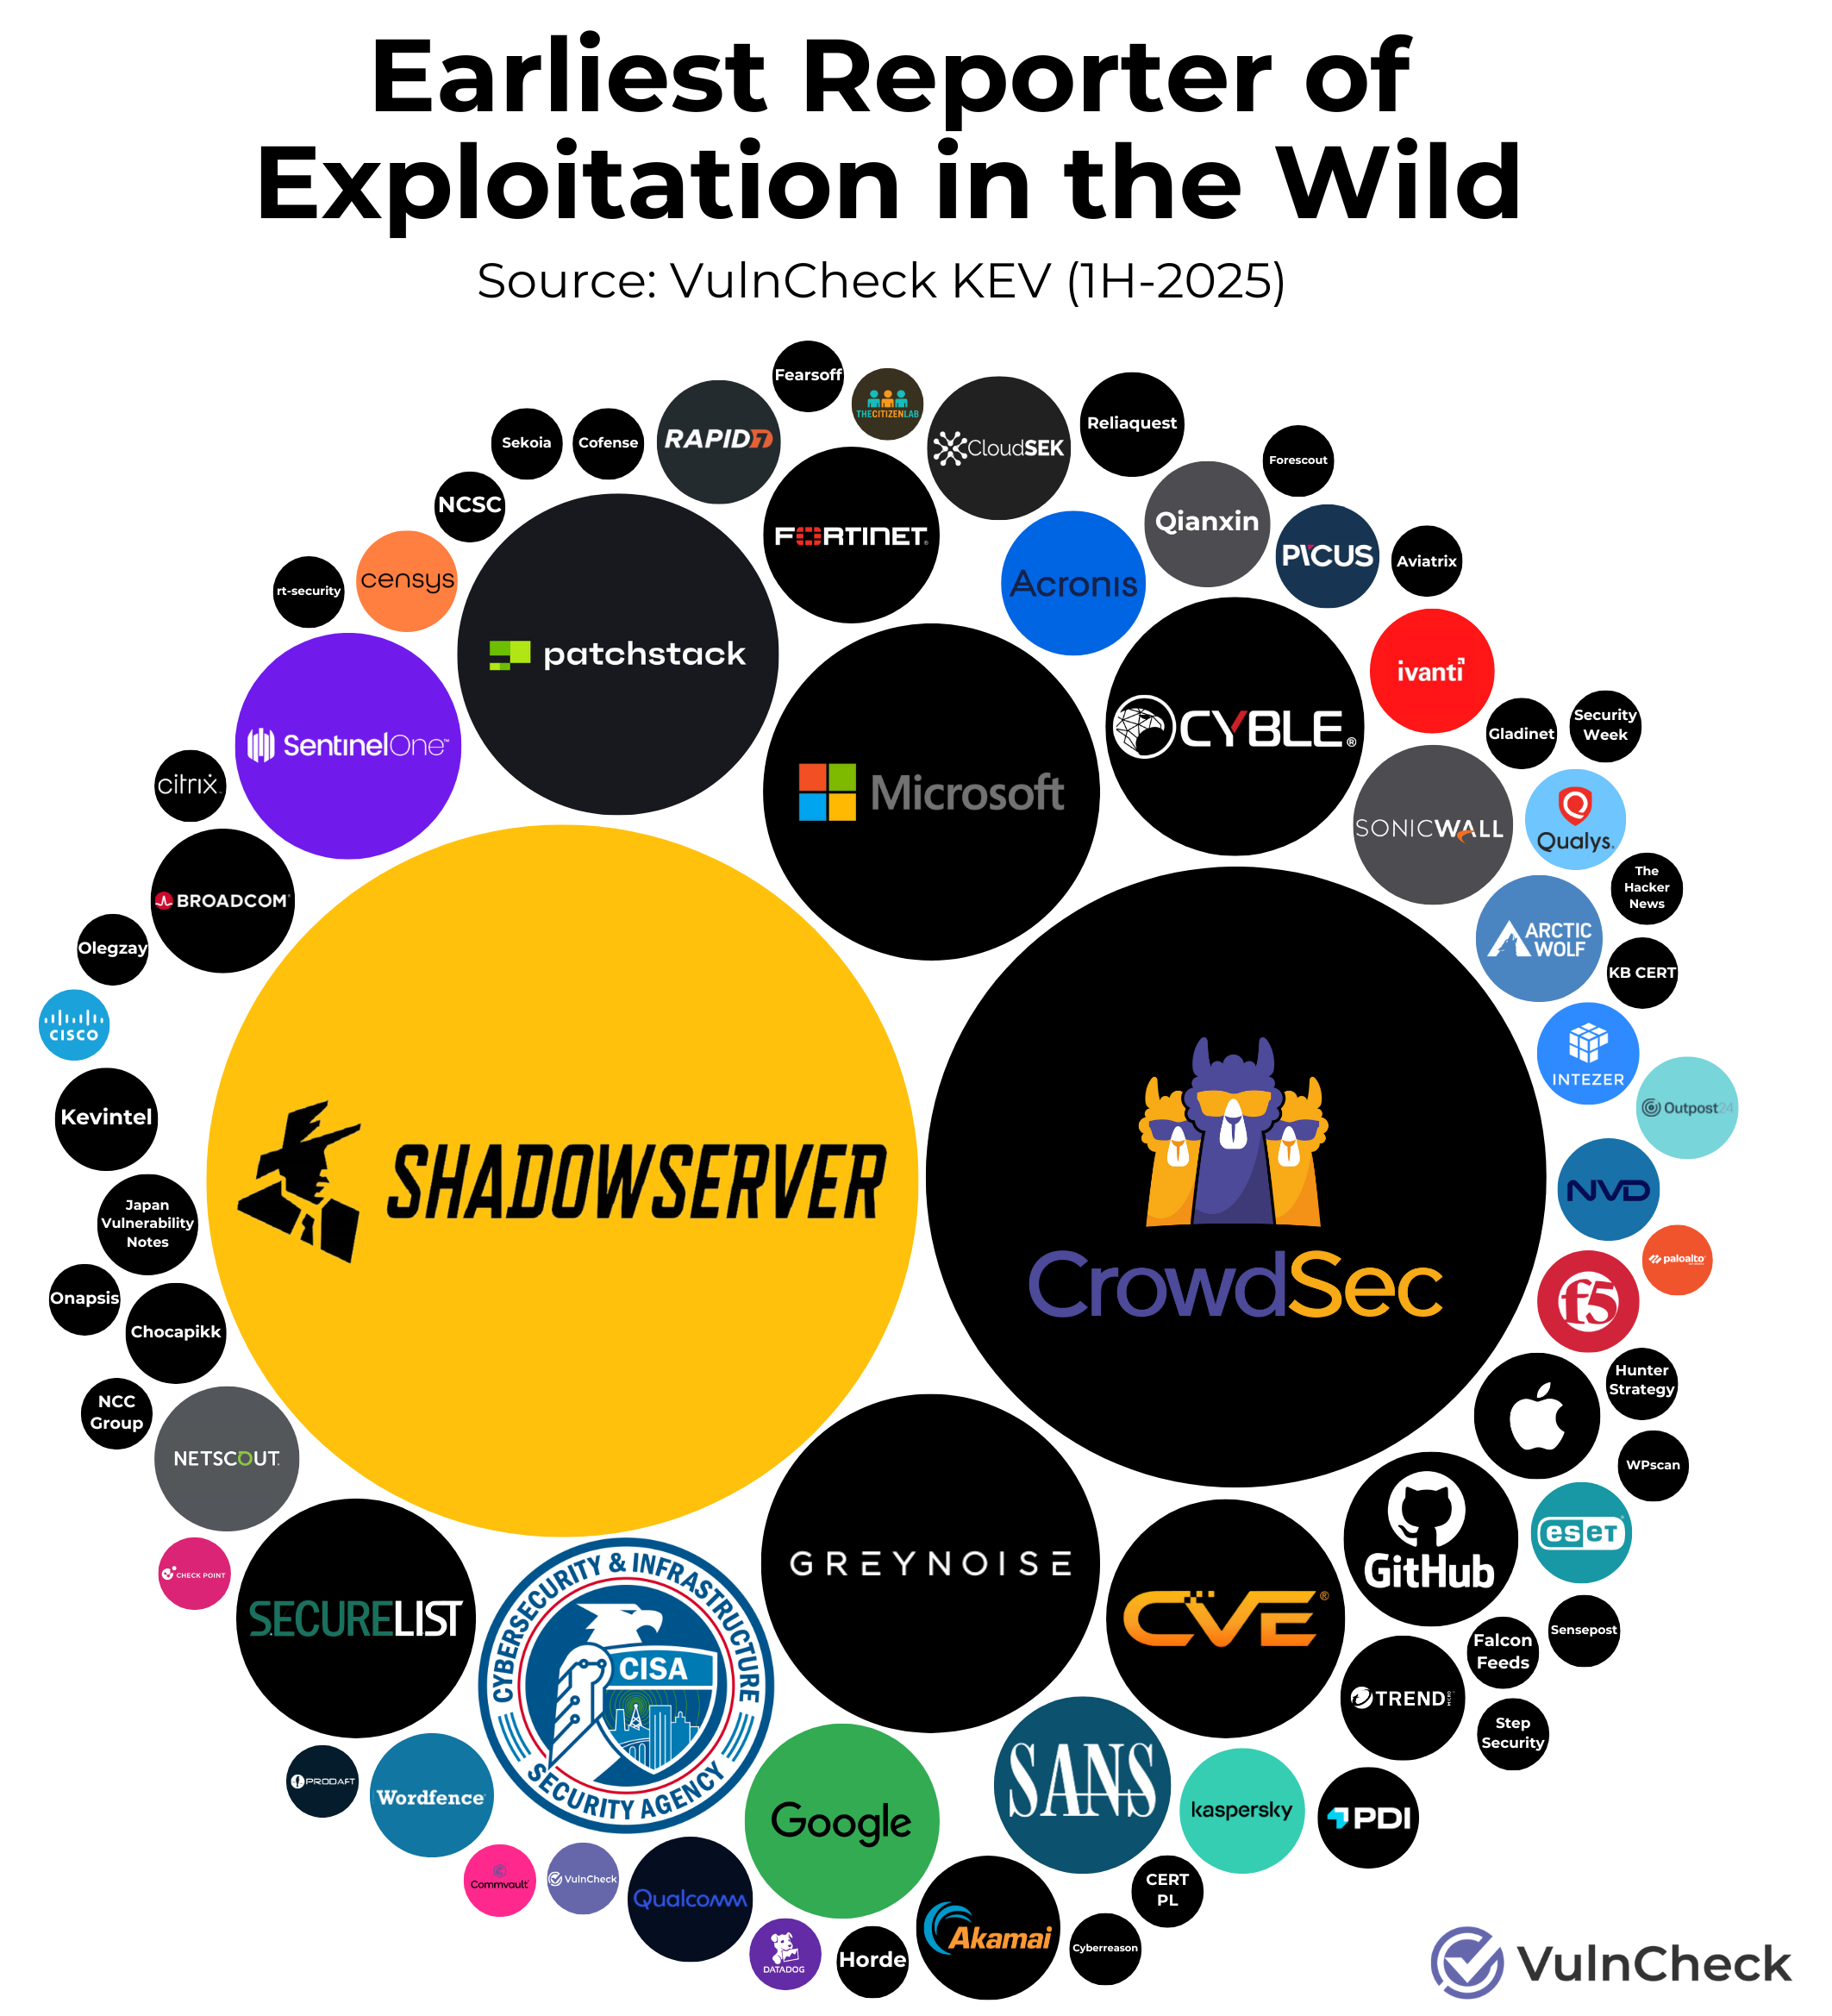
Evidence of exploitation for the 432 KEVs added to VulnCheck was first observed across more than 74 unique sources, highlighting the importance of having broad source coverage to ensure the earliest detection of exploitation. A comparison can be seen from the 1H-2024 state of exploitation report.
VulnCheck KEV focuses on monitoring more than 500 sources for exploitation evidence and delivers machine-readable access and Slack/email alerting to ensure defenders are aware of exploited vulnerabilities as early as possible.
Exploring Threat Actor Attribution
During 1H-2025, we analyzed and aggregated data from 139 unique industry reports that attributed vulnerability exploitation to threat actors. We identified 181 unique CVEs that were mentioned as being used by one of 92 named threat actors. Of the 181 CVEs, 147 had evidence of exploitation prior to 2025, demonstrating that threat actor exploitation disclosure often lags behind disclosure of initial exploitation evidence.
In February, we took a deep dive into the Black Basta chat logs, which offer a more detailed examination of attribution and targeting for an individual threat actor.
What countries were most commonly attributed to threat actors in the 1H-2025?
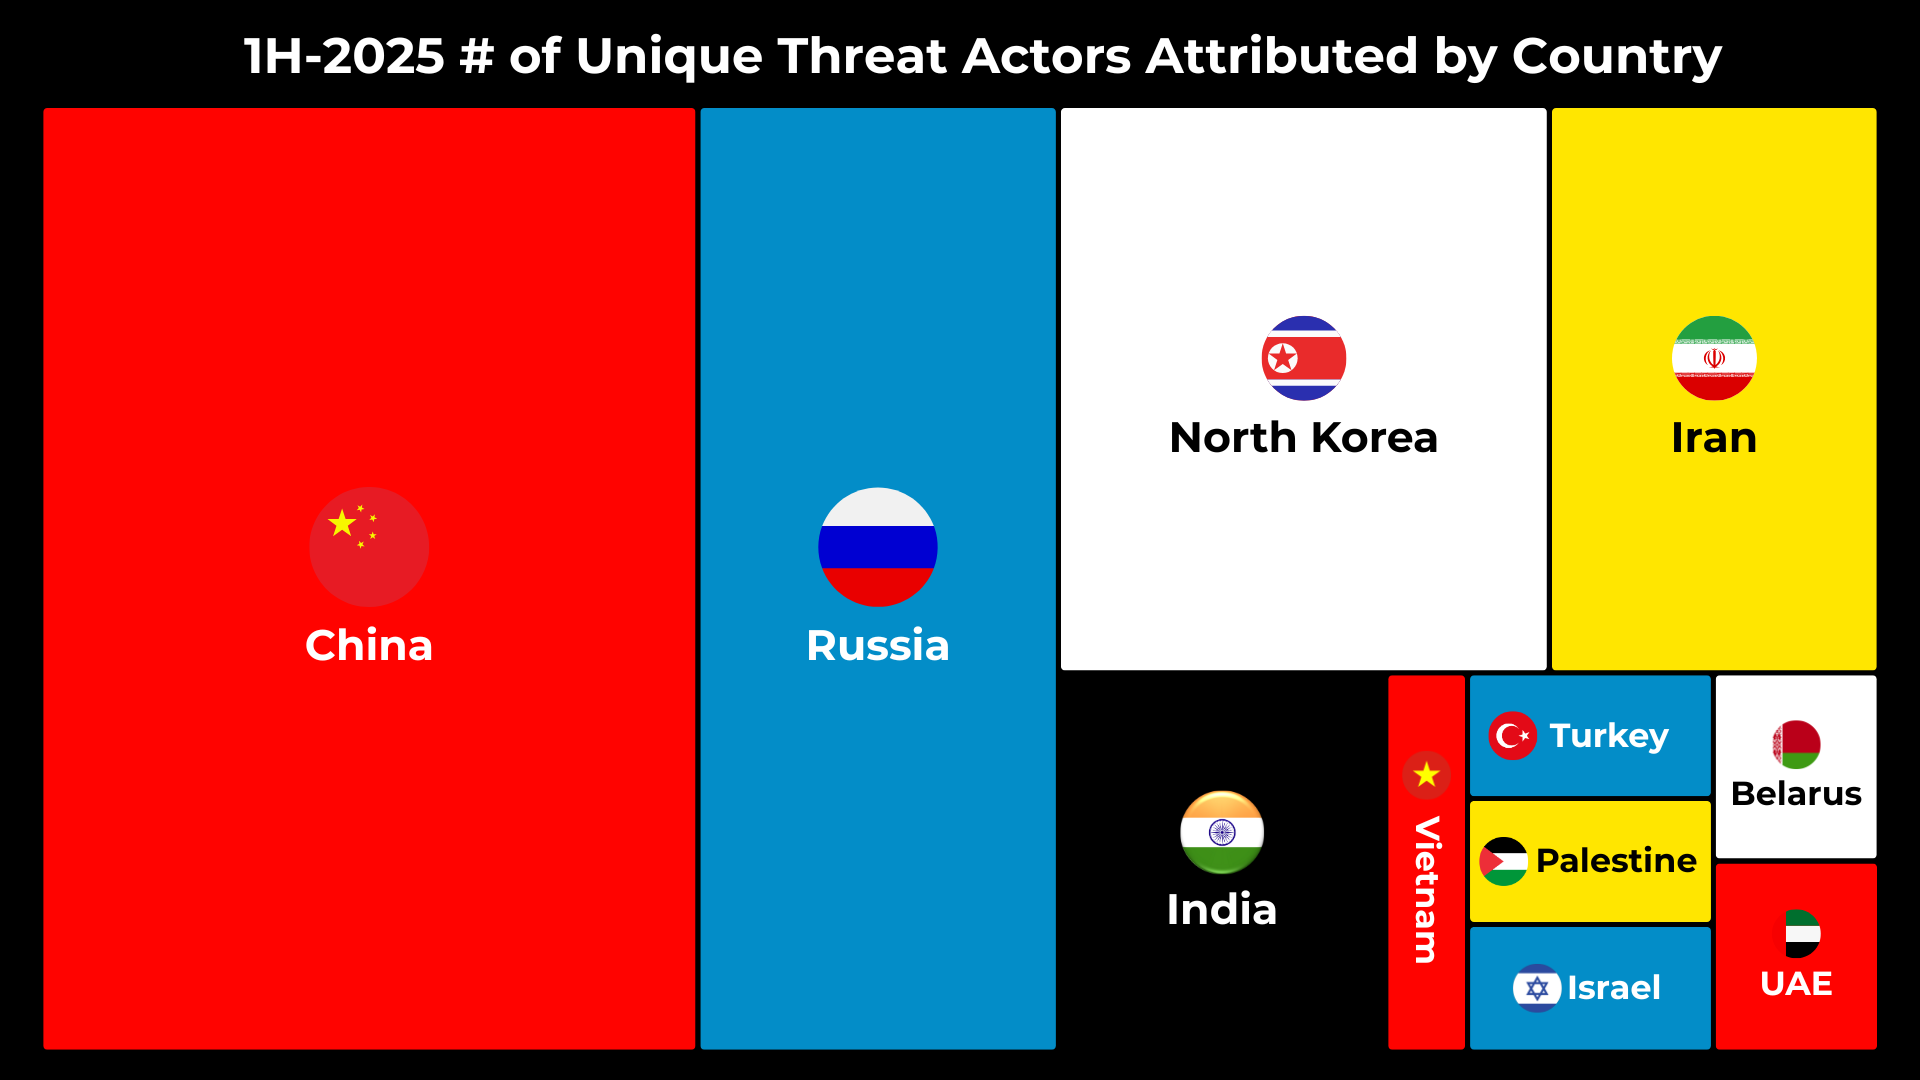
During 1H-2025, 92 unique threat actors were referenced across industry reports, of which 56 (60.8%) have an attributed country. If we look at the threat actors by attributed country, we quickly see that the usual suspects – China (20), Russia (11), North Korea (9), and Iran (6) – have the largest number of active threat actor groups. These countries are known for their cyber espionage and cyber activities, often being referred to as the four horsemen.
What does vulnerability attribution reported across all threat actors in the 1H-2025 look like?
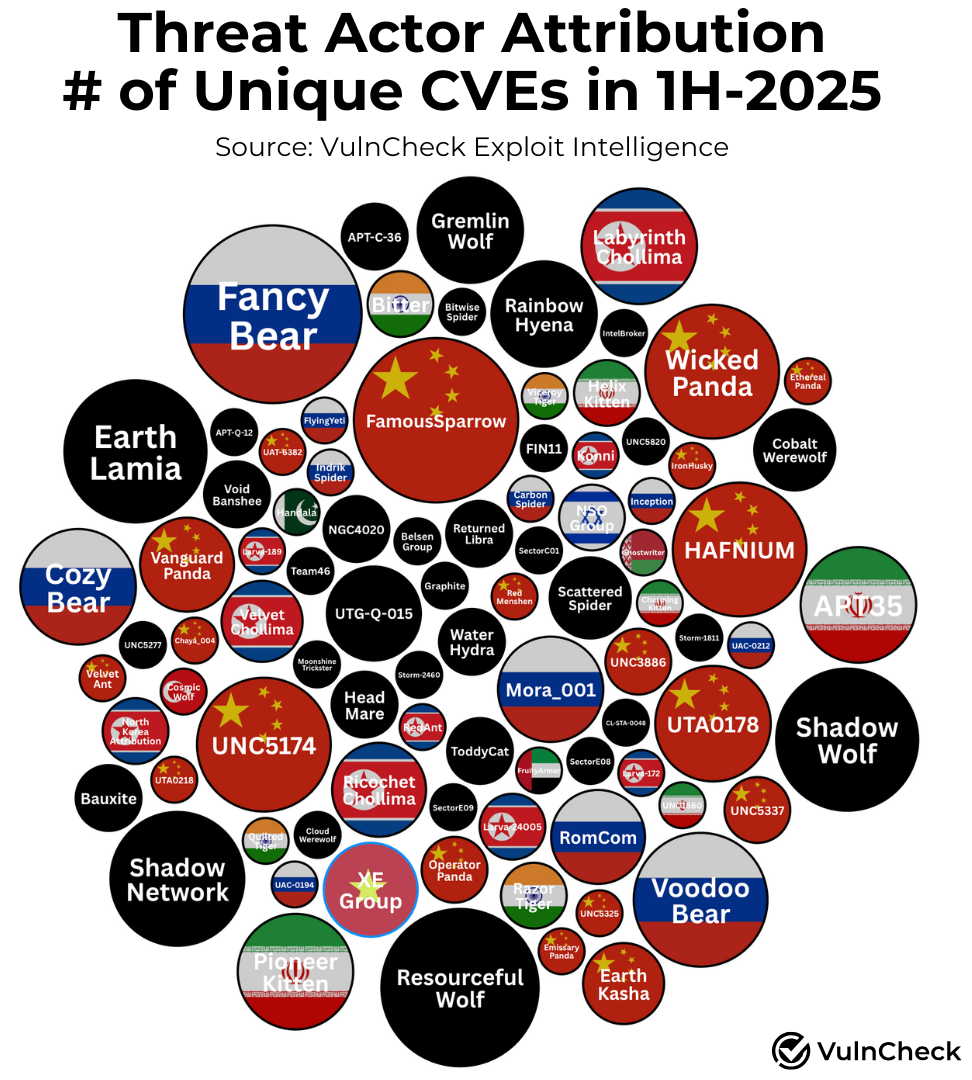
The following chart provides insight into attribution of unique vulnerabilities to threat actors. It highlights each threat actor, which has been normalized to incorporate the broad number of aliases and attributes the threat actor's country when applicable and the number of unique CVEs attributed in reports during the 1H-2025.
What nation states appear to be the most active?
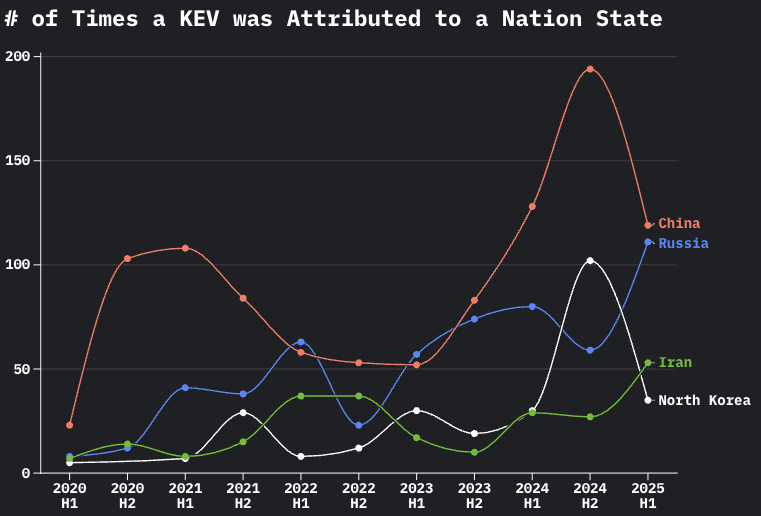
To provide some insight into which nation states appear to be the most relevant, we explored the number of times a known exploited vulnerability was attributable to the four horsemen (China, Russia, North Korea and Iran). During the 1H-2025, we observed a drop in reports of KEVs associated with China and North Korea while we saw an increase in reports of exploited vulnerabilities associated with Russia and Iran.
The spikes in the 2H-2024 and subsequent drops associated with China and North Korea can largely be attributed to the release of two government reports in the 2H-2024 People’s Republic of China-Linked Actors Compromise Routers and IoT Devices for Botnet Operations which attributed 66 KEVs to the chinese threat actor Flax Typhoon (AKA Ethereal Panda) and North Korea Cyber Group Conducts Global Espionage Campaign to Advance Regime’s Military and Nuclear Programs which attributed 44 KEVs to Silent Chollima.
Similarly the 1H-2025 increase in Iran attribution appears to largely tie to the Frequently Asked Questions About Iranian Cyber Operations research released by Tenable which attributes 29 KEVs to Iranian threat actors
The spike in Russian attribution isn’t tied to specific reports and attribution is broadly distributed across sources, which re-emphasizes Russia continues to be a major force behind threat activity and vulnerability exploitation.
How Has NIST NVD Performed for Known Exploited Vulnerabilities
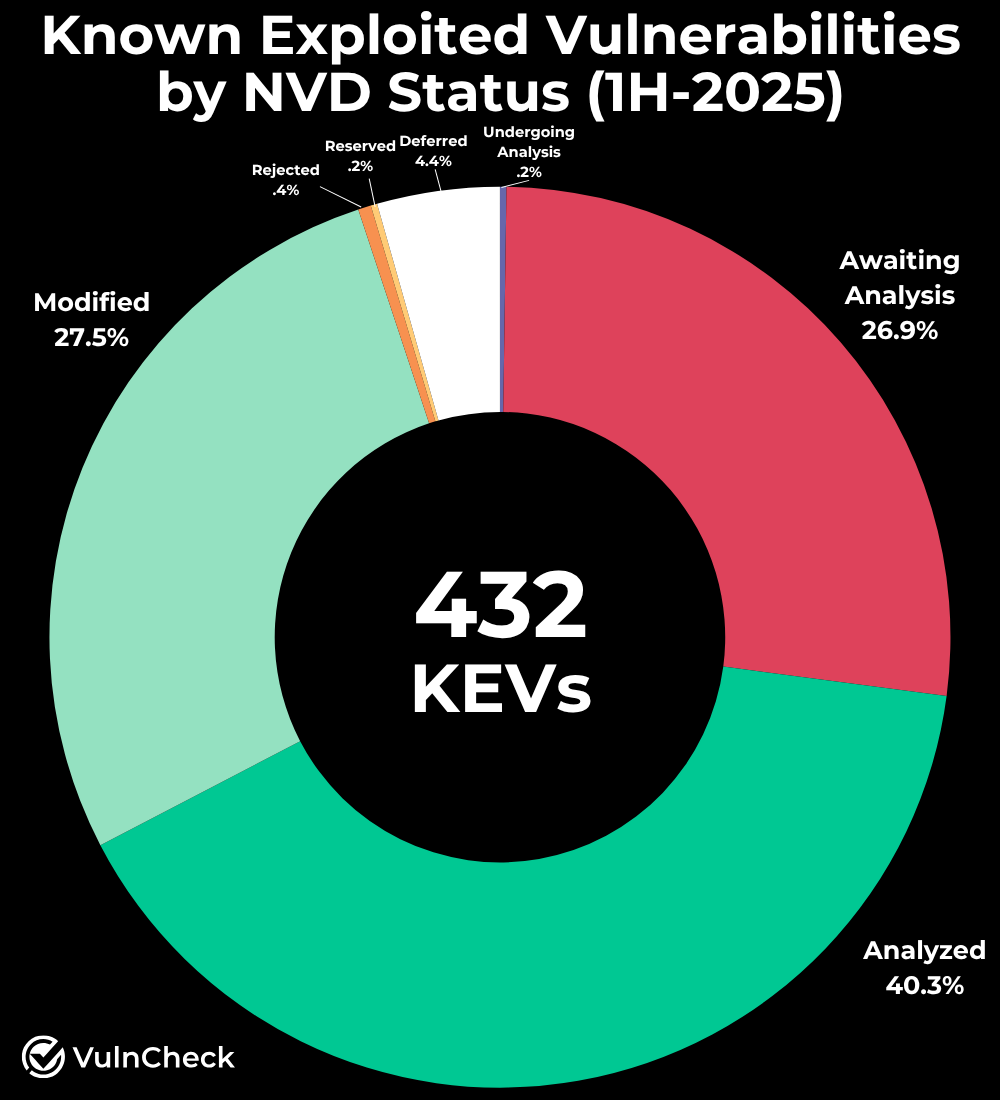
When we look at NIST NVD as an enrichment source for CVE records we see that 26.9% of KEVs first seen in the 1H-2025 were still awaiting analysis by NIST. Additionally, 4.4% of the KEVs are in a deferred status, meaning they are no longer maintained or updated by NIST. This highlights the continued challenges we’ve seen with resource challenges at NIST NVD since they lost funding in February 2024.
Summary of VulnCheck 1H-2025 Exploit Intelligence Report
The first half of 2025 highlights how quickly vulnerabilities are weaponized and the growing sophistication of global threat actors. With over 430 new KEVs, persistence in what appears to be zero-day exploitation, and shifting nation-state activity, defenders face an increasingly compressed timeline for response. Continued focus on timely vulnerability management, proactive intelligence, and broad exploitation monitoring remains essential to staying ahead of adversaries.
Considerations For This Report
[1] VulnCheck onboarded Crowdsec as a new intel source for KEVs prior to this reports cut off resulting in a significant contribution to the volume of KEVs reported.
[2] VulnCheck generated CVEs for 30+ vulnerabilties with exploitation activity in ShadowServer that did not previously have a CVE which contributed to volume and speed increases.
[3] For Threat Actor attribution we are using publicly reported instances of threat actor attribution which are likely to have some level of bias.
About VulnCheck
VulnCheck is helping organizations not just to solve the vulnerability prioritization challenge - we’re working to help equip any product manager, CSIRT/PSIRT or SecOps team and Threat Hunting team to get faster and more accurate with infinite efficiency using VulnCheck solutions.
We knew that we needed better data, faster across the board, in our industry. So that’s what we deliver to the market. We’re going to continue to deliver key insights on vulnerability management, exploitation and major trends we can extrapolate from our dataset to continuously support practitioners.
Are you interested in learning more? If so, VulnCheck's Exploit & Vulnerability Intelligence has broad threat actor coverage. Register and demo our data today.